
Case #26
-
History: 45 year old female with transient weakness
© 2012 Must See Radiology
History: 45 year old female with transient weakness
© 2012 Must See Radiology
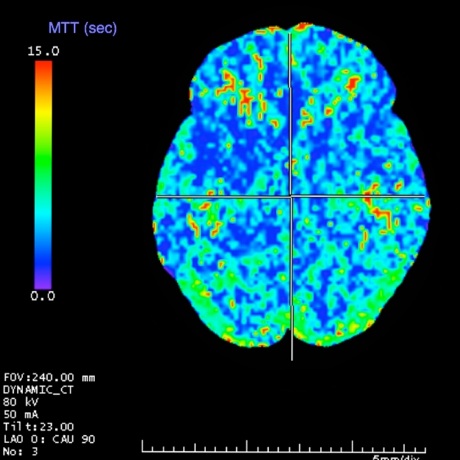
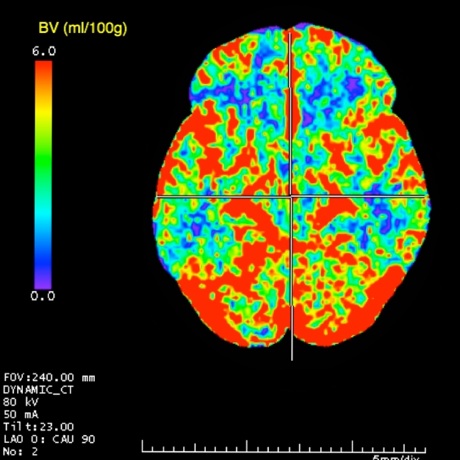
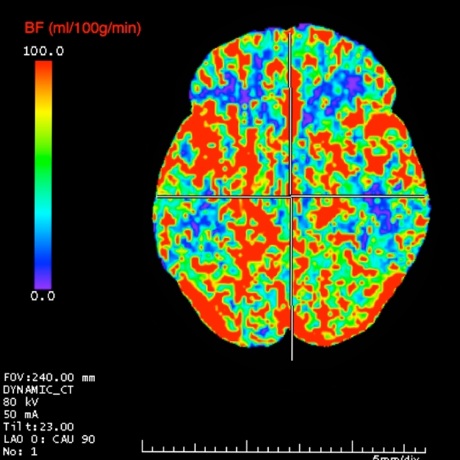
CT Perfusion images demonstrating Mean Transit Time (MTT), Blood Flow (BF), and Blood Volume (BV).
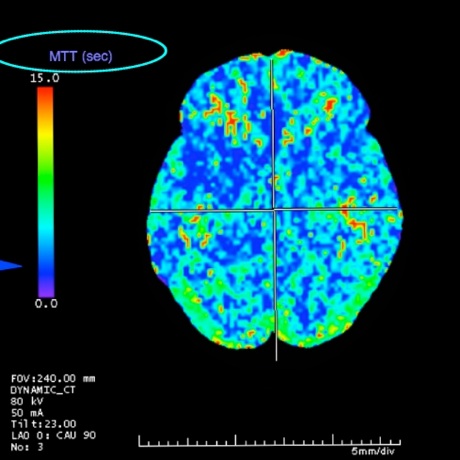
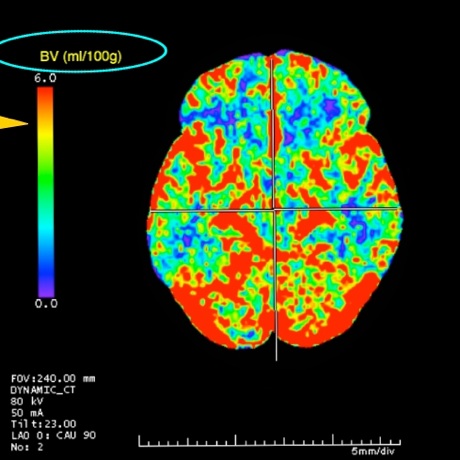
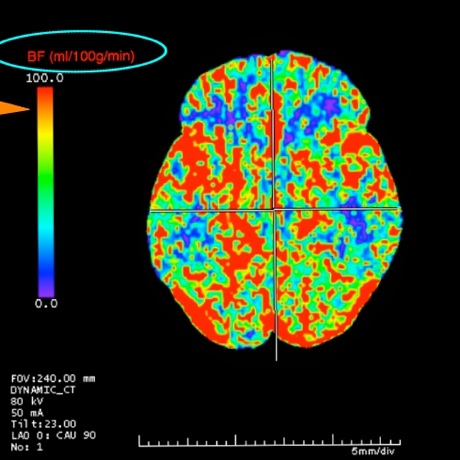
Noncontrast Head CT demonstrates no acute findings (not shown). CTA of the head is unremarkable. CT Perfusion images demonstrates a normal mean transit time (MTT), normal blood flow (BF) and blood volume (BV).
KEY_FINDING_3_TEXT

KEY_FINDING_4_TEXT

KEY_FINDING_5_TEXT

KEY_FINDING_6_TEXT

KEY_FINDING_7_TEXT
© 2012 Must See Radiology
Normal CT Perfusion Study
This case is an example of a normal CT Cerebral Perfusion, utilizing Tera Recon software. Depending on software and image rendering settings, the images at your institution may appear different than these.
CT Cerebral Perfusion imaging provides different color maps that allow fast determination of blood flow in the brain. Primary considerations are to determine areas of brain reversible ischemia vs irreversible infarction in patients with acute stroke. Details and further examples can be found in the article reference below. Here's a brief summary of the basics:
MTT= Mean Transit Time. measured in seconds.
CBV = Cerebral Blood Volume. measured as ml / 100g.
CBF = Cerebral Blood Flow. Measured as ml / 100g / min.
Relationship shown in central blood volume principle equation:
Usual order of exams for evaluating acute strokes with CT perfusion include the following:
1. Noncontrast Head CT: Evaluate for mass or intracranial hemorrhage.
2. CTA Head and Neck: Evaluate for occlusion of arteries.
3. CT Perfusion Head: Evaluate infarction core versus ischemia.
4. Proceed to neuro interventional suite, if appropriate.
5. Post-procedure MRI (or post-pefusion, if procedure not performed)
2. Evaluate the MTT images first. Normal MTT is low and on the images provided, corresponds to a blue color. Areas of increased MTT (red) reflect areas of ischemia. It is measured on a scale of 0-15 (s). The threshold for ischemia is great than 6 seconds. MTT is thought to be the most sensitive to brain ischemia, therefore viewing it first will help localize subtle findings not as well seen on the CBF and CBV images.
3. Evaluate CBF images next. Normal CBF is high. It is presented on a scale of 0 to 100 (ml / 100g / min). Normal is at least 55. On the color maps, normal CBF will be red or yellow. Abnormal blood flow representing ischemia will measure less than 10 on the scale and are represented as blue in color. Note that MTT and CBF are inverse of each other, as determined by the equation above. CBF maps show the best correlation between critical ischemia and postmortem evaluation results. If there are abnormalities, further evaluate the area on the CBV map. Ischemia vs Infarction is not clearly defined on CBF or MTT images.
4. Evaluate CBV images last. CBV images are most specific for areas of infarction. CBV is measured on a scale of 0 to 6 (ml/100g) with the threshold of ischemia measuring 0-1.5. Normal CBV is high, represented by the yellow -> red spectrum. Areas of infarction are shown as blue. An area of infarction on CT Perfusion is closely correlated with an area of infarction identified on MRI with diffusion weighting.5. If an infarction core is identified on CBV, compare the size and location with the findings on CBF to determine the extent of irreversible infarction (blue on CBV) versus reversible ischemic penumbra (blue on CBV).
Go to Case #27 See Case #27 for a good example of an MCA stroke demonstrating a large area of reversible ischemia (red on MTT, blue on CBF) and a small infarction (blue on CBV).
Additional Information:
Hoeffner, EG. "Cerebral Perfusion CT: Technique and Clinical Applications." Radiology June 2004: 231, 632-644.
© 2012 Must See Radiology
Not available at this time.
Rating not available at this time.
Any feedback regarding this case can be emailed to Tony@mustseeradiology.com
Thank you for trying Must See Radiology!
© 2012 Must See Radiology